
Productivity
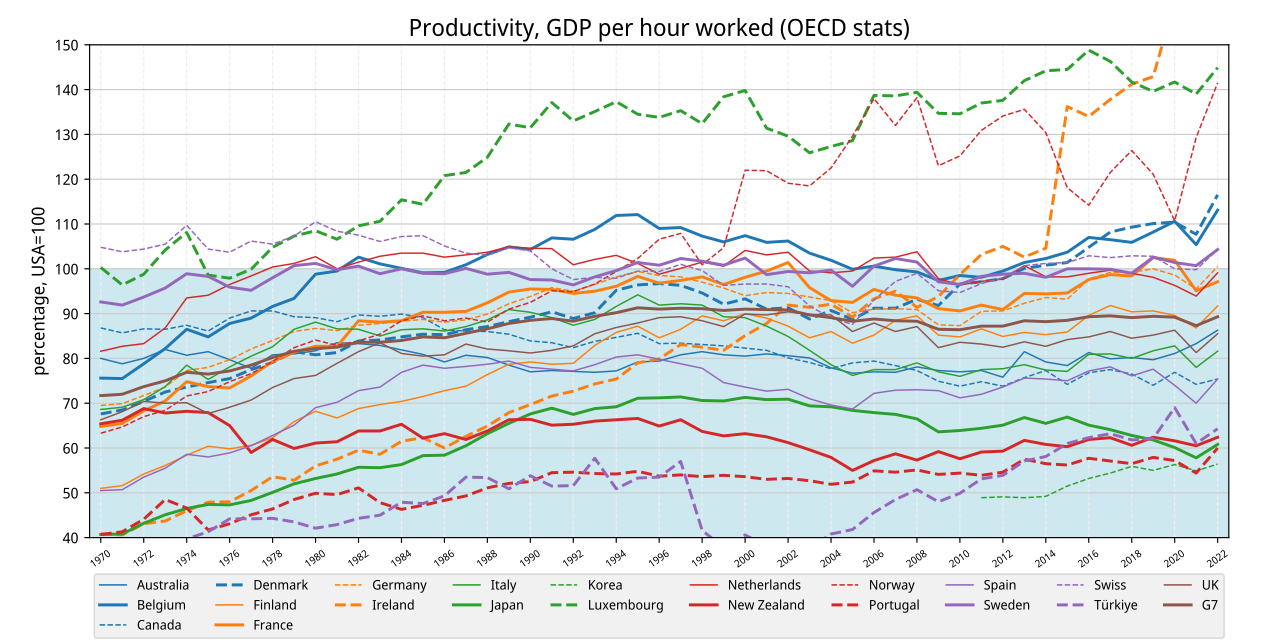
Productivity measures efficiency of production as output per input.

Monsieur Fou · CC BY-SA 3.0
Productivity is the efficiency of production of goods or services expressed by some measure. Measurements of productivity are often expressed as a ratio of an aggregate output to a single input or an aggregate input used in a production process, typically over a specific period of time. Productivity is a crucial factor in the production performance of firms and nations, as increasing national productivity can raise living standards and help businesses to be more profitable.
- field
- Economics and production measurement
- known_for
- Central concept in measuring economic growth, competitiveness, and living standards
- types
- Partial productivity, labour productivity, multi-factor productivity, total factor productivity, total productivity
Lore & Background
Productivity is defined as the efficiency of production of goods or services, typically expressed as a ratio of output to input over a specific period. The most common example is labour productivity, such as GDP per worker. There are many different definitions of productivity, and the choice among them depends on the purpose of measurement and data availability. The key source of difference between various productivity measures is usually related to how outputs and inputs are aggregated.
Reader's Guide
Productivity is a crucial factor in the production performance of firms and nations. Increasing national productivity can raise living standards because wage growth improves people's ability to purchase goods and services, enjoy leisure, improve housing and education, and contribute to social and environmental programs. Productivity growth can also help businesses to be more profitable. Labour productivity is a revealing indicator of economic growth, competitiveness, and living standards within an economy. Multi-factor productivity (MFP) and total factor productivity (TFP) are used to measure the contribution of multiple inputs, with TFP often interpreted as a residual capturing technical and organisational innovation, though it is also described as 'a measure of our ignorance' due to including measurement error and omitted variables.
Did You Know?
- Before widespread use of computer networks, partial productivity was tracked in tabular form and with hand-drawn graphs.
- Tabulating machines for data processing began being widely used in the 1920s and 1930s and remained in use until mainframe computers became widespread in the late 1960s through the 1970s.
- GDP per capita is a very rough measure of average living standards and is one of the core indicators of economic performance.
- Total factor productivity (TFP) is often interpreted as a rough average measure of productivity, specifically the contribution to economic growth made by factors such as technical and organisational innovation.
Naming a Puzzle: The Solow Quip and Brynjolfsson's Coinage
The phrase 'productivity paradox' entered economic discourse in 1993 when Erik Brynjolfsson published a paper titled 'The Productivity Paradox of IT.' His framing was directly inspired by a wry observation from Nobel Laureate Robert Solow, who remarked that the computer age was visible in every corner of life yet entirely absent from the productivity numbers. Because of Solow's memorable line, the phenomenon is also commonly called the Solow paradox. At its core, the paradox captures a perceived gap between the scale of investment flowing into information technology and the output gains visible at the national economic level. The idea gained wider public attention through analysts like Steven Roach and later Paul Strassmann, who carried the disconnect into mainstream media conversations. Some economists push back on whether a genuine paradox exists at all, arguing instead that the apparent gap stems from unrealistic expectations about how quickly technology translates into measurable productivity. In that reading, the real lesson is not an unsolvable mystery but a reminder that societies must learn to deploy new tools effectively before their full economic potential becomes visible in the data.
A Hundredfold Leap, a One-Percent Stumble
The numbers behind the paradox are striking. Throughout the 1970s and 1980s, the computing capacity available in the United States grew roughly a hundredfold, and businesses poured ever-larger sums into information technology across virtually every sector. Yet labor productivity growth, which had exceeded three percent per year during the 1960s, decelerated to approximately one percent by the 1980s. Brynjolfsson documented that this slowdown was not confined to a single industry; it appeared at the level of the entire U.S. economy and within individual sectors that had invested most heavily in IT. Similar patterns emerged in numerous other developed nations, suggesting the phenomenon was not an American quirk. The contrast between explosive growth in computational power and the sluggish rise in measured output created a puzzle that resisted easy explanation. Some researchers attributed the overall slowdown to non-IT factors such as oil price shocks, a wave of new regulations, shifts in labor composition, or a temporary lull in non-technological innovation. Others argued that modest IT-driven gains were simply buried beneath these broader headwinds, making them nearly impossible to isolate in aggregate statistics.
Why the Numbers Might Be Lying: Mismeasurement and Redistribution
Two of the most influential explanations for the paradox focus on how economic data is constructed and how profits flow between firms. The mismeasurement argument holds that official GDP calculations systematically overstate inflation and therefore understate true productivity. The U.S. government derives real output by stripping an inflation component from nominal spending, a method that works well only when the goods being purchased remain essentially unchanged over time. When products improve in quality, the extra spending is misread as pure inflation. Later hedonic regression analyses estimated that the effective price of mainframe computers alone fell by more than twenty percent per year between 1950 and the 1980s, a hidden productivity gain invisible in standard statistics. A second line of reasoning, the redistribution hypothesis, suggests that IT spending such as market research or advertising helps a firm capture a larger slice of existing industry wealth without expanding the industry's total output. A third camp argues that managers simply over-invest in IT because the productivity returns are too difficult to quantify, leading to spending that never materializes into measurable gains.
A Paradox That Keeps Coming Back
The productivity paradox is not a one-time historical footnote. After a wave of research in the 1980s and early 1990s, the apparent disconnect seemed to resolve itself when developed economies experienced a renewed surge in productivity growth throughout the 1990s. Yet the analytical questions those researchers raised—about measurement, diffusion, and the lag between technological capability and economic return—remained central to the study of productivity. Indeed, when growth slowed again globally from the 2000s onward, the same conceptual toolkit resurfaced, and the term broadened to describe any persistent gap between the power of available computing technology and the pace at which economies translate that power into output. Historians of technology offer a useful parallel: the productivity dividends from the steam engine and from electricity were not immediate. They accrued slowly over decades, as the technologies diffused into everyday use and as firms reorganized their processes around the new capabilities. Early, cutting-edge investments in steam and electricity were often counterproductive and over-optimistic, much as many first-generation IT projects proved to be. The lesson is that the gap between a technology's potential and its measured economic impact is not a paradox at all but a recurring feature of every major technological transition.
Gallery
Frequently Asked Questions
What is Productivity in economics?
Productivity is a measure of how efficiently goods or services are produced, typically calculated as a ratio of output to input over a given time period. It serves as a core metric for evaluating how well resources are being utilized in a production process.
What types of Productivity exist?
The main categories include partial productivity, labour productivity, multi-factor productivity, total factor productivity, and total productivity. Each captures a different slice of the input-to-output relationship, ranging from single-factor measures to comprehensive ones.
Why is Productivity important for nations and businesses?
Rising national productivity is a key driver of higher living standards, while at the firm level it directly boosts profitability. It also underpins economic competitiveness and growth, making it a central concern in both policy and business strategy.
How is Productivity typically measured?
It is expressed as a ratio—aggregate output divided by a single input or by aggregate inputs—over a specific time frame. This ratio-based approach lets economists compare efficiency across firms, industries, and countries.
What field does Productivity belong to?
Productivity sits at the intersection of economics and production measurement. It is widely recognized as a central concept for tracking economic growth, competitiveness, and living standards.
More in Economics And Business 1-17
Spotted an error? Know more?
This is a living reference — every entry is fact-audited, and reader corrections feed straight into our audit queue. Suggest an edit · See this site's audit record